@[email protected] to Political [email protected] • 1 year agoSICKOSlemmy.worldmessage-square25fedilinkarrow-up1177
arrow-up1162imageSICKOSlemmy.world@[email protected] to Political [email protected] • 1 year agomessage-square25fedilink
minus-square@[email protected]linkfedilink8•1 year agoThis graph is objectively incorrect which does a disservice to the real problem it’s intended to address. This is misinformation.
minus-square@[email protected]OPlinkfedilink3•1 year agoNo it isn’t https://en.wikipedia.org/wiki/Obesity_in_the_United_States
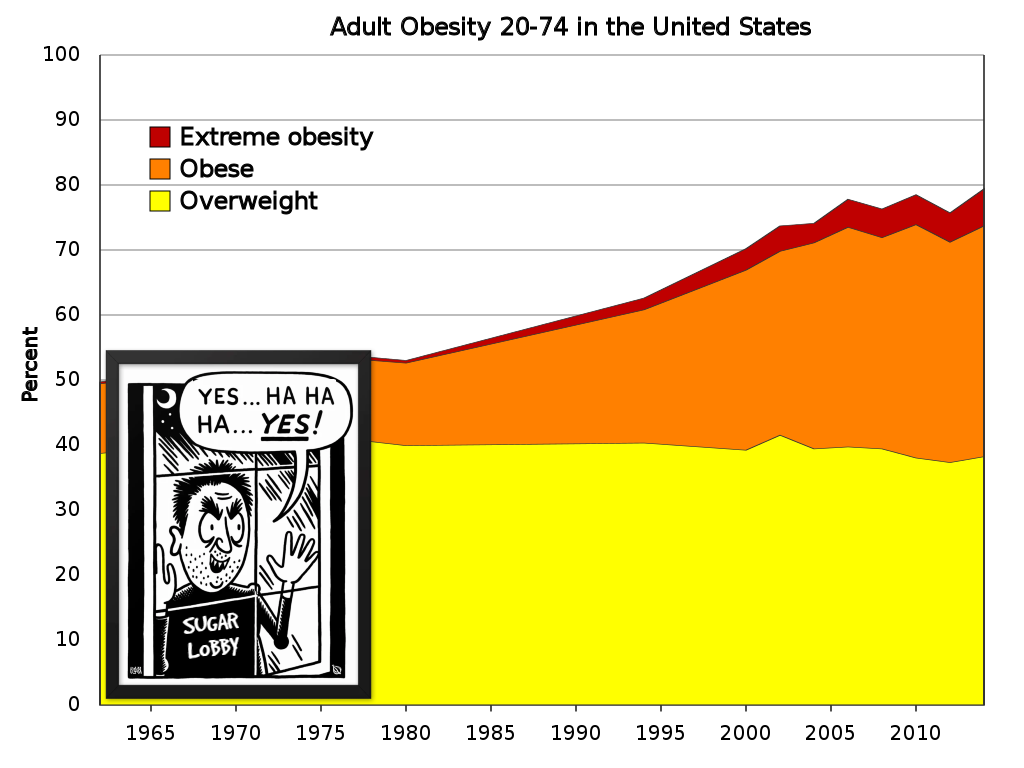
minus-square@[email protected]linkfedilink2•1 year agoI want both of you to elaborate. I don’t think anyone is denying obesity rates are doing up, but the graph doesn’t seem like a good way to show this? It doesn’t even include healthy weight people.
minus-square@[email protected]linkfedilink9•1 year agoAren’t healthy weight people the white space above the line?
minus-square@[email protected]linkfedilink4•1 year agoScale goes from 0 to 100% so yes I’d say you’re correct, minus maybe anorexic people.

This graph is objectively incorrect which does a disservice to the real problem it’s intended to address. This is misinformation.
No it isn’t
https://en.wikipedia.org/wiki/Obesity_in_the_United_States
I want both of you to elaborate. I don’t think anyone is denying obesity rates are doing up, but the graph doesn’t seem like a good way to show this? It doesn’t even include healthy weight people.
Aren’t healthy weight people the white space above the line?
Scale goes from 0 to 100% so yes I’d say you’re correct, minus maybe anorexic people.