@[email protected] to [email protected] • edit-27 months agoHas to be those frozen wind turbines and solar panels...lemmy.worldmessage-square86fedilinkarrow-up1410file-text
arrow-up1410imageHas to be those frozen wind turbines and solar panels...lemmy.world@[email protected] to [email protected] • edit-27 months agomessage-square86fedilinkfile-text
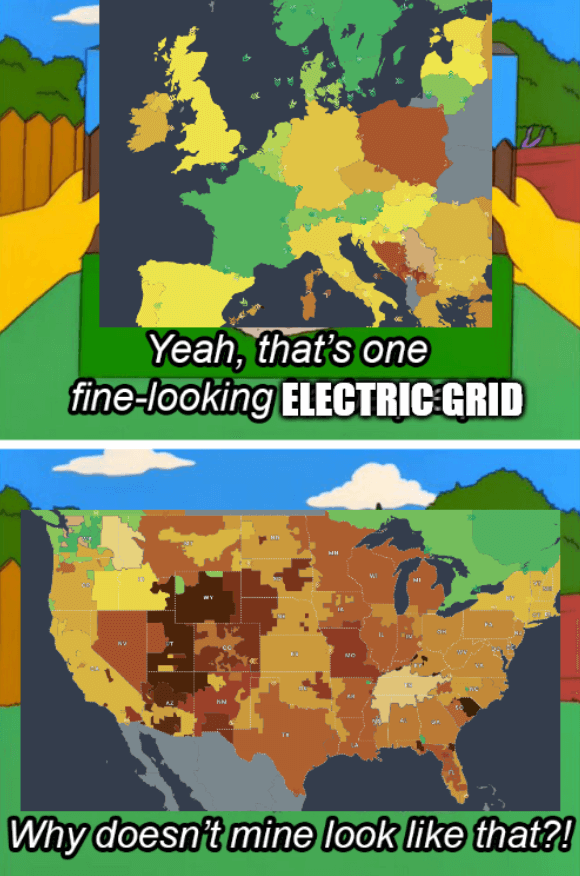
Template Source - The colors of the grids represent CO2 emissions The title is a reference to the 2021 Texas power crisis
minus-square@[email protected]linkfedilink1•7 months agoSpain has lots of solar and wind and is fairly green.
minus-square@[email protected]linkfedilink2•7 months agoThe yearly average for Spain in 2023 is 160g CO2/kWh (yellow). 25% of their electricity was produced with wind, 22% nuclear, 16% solar and 10% hydro. And also 22% of gas that brought their CO2 up.


Spain has lots of solar and wind and is fairly green.
The yearly average for Spain in 2023 is 160g CO2/kWh (yellow).
25% of their electricity was produced with wind, 22% nuclear, 16% solar and 10% hydro. And also 22% of gas that brought their CO2 up.