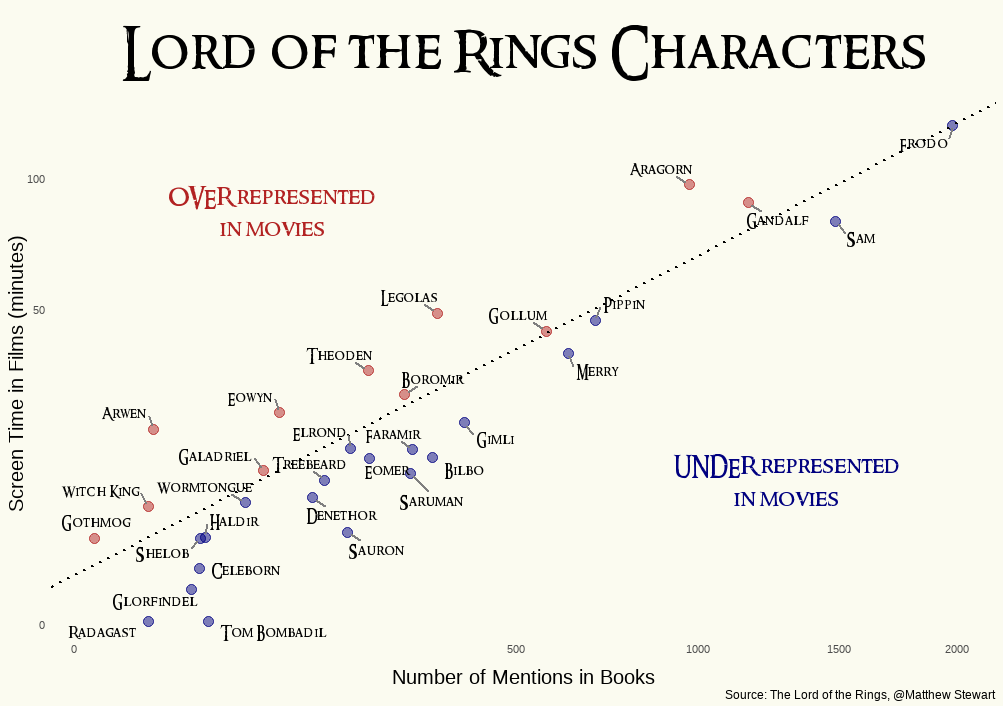
Logarithmic cannot start at 0 and would have equal spacing between 500, 1000 and 2000.
I am confused because the font seems to be Aptos, the current default in Micro$oft Office, but Excel does not allow any other type of scale on X-Y plots.
Every time a number doubles (or increases 10×, or 𝑒×, whatever), it moves a constant distance on a log scale because its base-whatever logarithm increases by a constant amount. Hence my expectation of equal distance from 500 to 1000 and 1000 to 2000. I am ignoring 1500 here because it does not form a geometric sequence with any two other numbers so it can’t easily be used for this check.
Well, I’d like to know if Arwen’s screentime/mention ratio is 2x or 3x that of the Frodo baseline. This arbitrary scale makes it impossible. It would not hurt to add more values to the axes, and perhaps a faint grid.


The scale is neither linear nor logarithmic. What?
How else can you make it look like a linear grouping?
Data processing isn’t about making it look like something unless you are purposefully manipulating it.
But that’s what happened here. The x-axis has been unevenly distributed.
I think it is logarithmic, it’s just marked linearly.
Logarithmic cannot start at 0 and would have equal spacing between 500, 1000 and 2000.
I am confused because the font seems to be Aptos, the current default in Micro$oft Office, but Excel does not allow any other type of scale on X-Y plots.
That’s not equal spacing - 1000-1500 is a bit longer than 1500-2000.
The graph is almost certainly logarithmic. Only the markings are stupid.
Every time a number doubles (or increases 10×, or 𝑒×, whatever), it moves a constant distance on a log scale because its base-whatever logarithm increases by a constant amount. Hence my expectation of equal distance from 500 to 1000 and 1000 to 2000. I am ignoring 1500 here because it does not form a geometric sequence with any two other numbers so it can’t easily be used for this check.
Because the point isn’t to compare 2 characters, but to see how one character performs in the books and in the movies.
And for that, it doesn’t matter. But they could have used a bar graph instead.
Well, I’d like to know if Arwen’s screentime/mention ratio is 2x or 3x that of the Frodo baseline. This arbitrary scale makes it impossible. It would not hurt to add more values to the axes, and perhaps a faint grid.