This website contains age-restricted materials including nudity and explicit depictions of sexual activity.
By entering, you affirm that you are at least 18 years of age or the age of majority in the jurisdiction you are accessing the website from and you consent to viewing sexually explicit content.
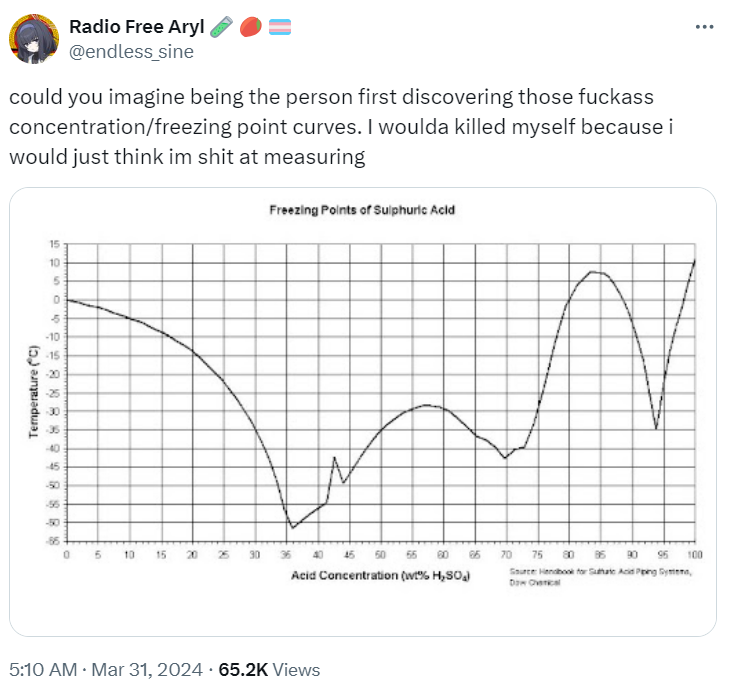
My uneducated understanding is that the chart shows at which temperatures sulfuric acid freezes depending on the concentration. Also in my very basic understanding of physics and chemistry I would have thought that it’s linear or exponential or something predictable and not that jumpy.
In normal cases you’d see two curves going away from pure compounds downwards to a common minimum, which is eutectic point. It’s generally only vaguely predictable, but always monotonic
Here’s what a normal curve looks like:
https://i2.wp.com/www.storksplows.com/docs/wp-content/uploads/2017/04/Brine-Pro-salinity-chart.png