This website contains age-restricted materials including nudity and explicit depictions of sexual activity.
By entering, you affirm that you are at least 18 years of age or the age of majority in the jurisdiction you are accessing the website from and you consent to viewing sexually explicit content.
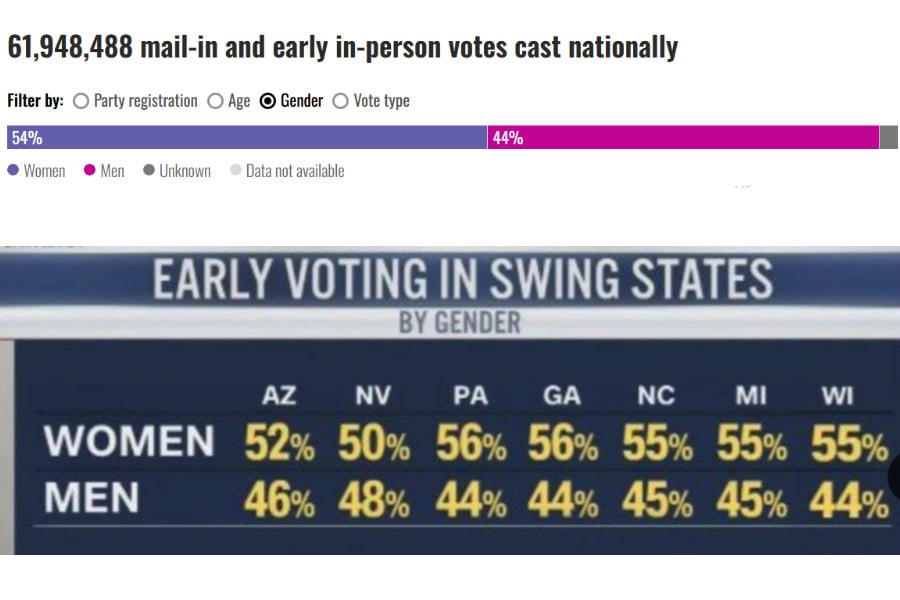
wtf? are these data random generated? they don’t make sense.
there is 40% of republicans in 62 millions casted votes (so roughly 25 million) and suddenly 30% in the 63 million (roughly 19 million?) requested ballots?
either i am missing something, or these data are so imprecise that trying to analyse them is a fools errand.
About half the states allow same-day voter registration, so there may be people who voted but did not specifically request mail in/early voting, and those who did request but have not cast their vote yet. So, for many states you could be in one set but not the other.
ok, thank you. still - the fact there is such variance in the results means you shouldn’t really try to draw any conclusions from it.
Agreed. It’s basically the political version of reading tea leaves.